

 |
Present pressure‑indicating‑film experiments measure pressure uniformity within the wafer‑to‑wafer bonding chamber and compare several types of under‑bump metallization.
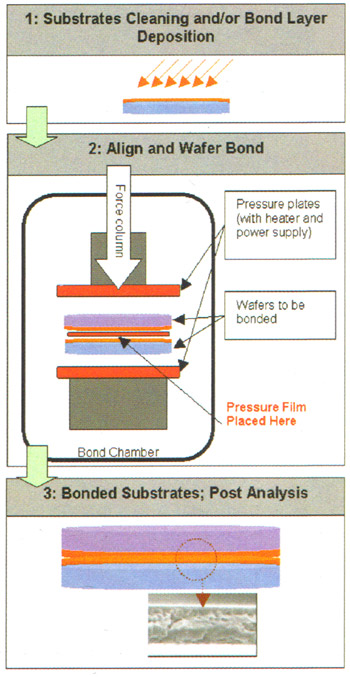
Wafer‑to‑wafer bonding has become an enabling semiconductor technology for industries such as 3D packaging, MEMS, MOEMS, and SOI. In a typical wafer‑bonding process, two flat substrates are permanently joined (bonded) to one another by applying physical pressure, temperature, and/or an electric field (Figure 1). Each of these parameters is set according to the substrate materials being bonded, and controlling these parameters is critical for a successful, high‑quality, highly uniform manufacturing process.
Among these three main parameters, electric field and temperature can be readily measured inside the wafer‑bonding chamber using built‑in electronics and thermocouples. Pressure, however, is commonly measured in the tool as the total force applied to the pressure column. The measured force is then used to calculate average pressure under the assumption that the pressure plate is perfectly flat. In practice, though, pressure plates are often not ideal, or they may degrade over time. This can lead to latent pressure variations that go undetected by the control software. Poor pressure distribution may result in poorly bonded or completely unbonded wafer regions, wafer fracture, or premature wear of the pressure plates.
Wafer‑Bonding Process
Figure 1. Wafer‑bonding process.
The importance of uniform pressure application during bonding depends heavily on the specific materials being joined. For example, in the anodic bonding process, silicon is bonded to glass by applying a large electric field (500 V) at elevated temperature (> 300 °C)¹. A reaction between silicon and oxygen then forms very strong SiO₂ bonds. Since the magnitude of electrostatic force is generally sufficient to achieve full bonding, physically applied pressure is neither critical nor required for this type of bonding process.
Nevertheless, control of applied pressure is highly important in eutectic or thermocompression bonding processes, in which two dissimilar substrates are joined using a thin intermediate film, typically a metal alloy¹‑³. In this bonding mode, the two surfaces to be bonded are brought into contact, and the temperature is raised above the eutectic point. Once the eutectic temperature is reached, the solder liquefies, and the wafers bond upon contact.
Excess pressure can physically squeeze the liquefied solder, potentially causing it to spread into undesired areas and resulting in electrical short circuits. Insufficient pressure typically yields weak bonds or regions with no bonding at all. In fact, for non‑optimized bonding systems (considering bonding‑process parameters as well as the materials used), both squeeze‑out and unbonded regions can occur on the same pair of substrates due to non‑uniform pressure, temperature, or solder distribution. Therefore, characterization of applied pressure measured directly on the substrates is essential for developing high‑yield bonding processes.
|
| Wafer‑Bonding Process |
 |
Pressure‑Indicating Film Experiment
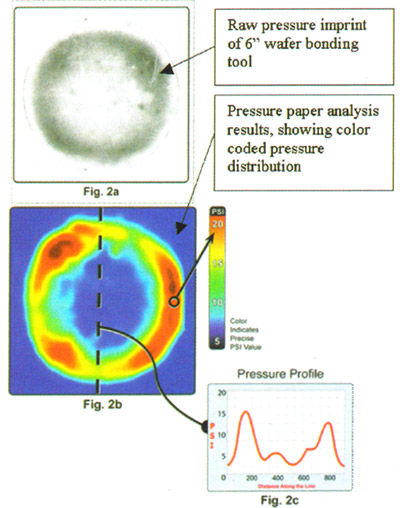
Pressurex ® film is a pressure‑sensitive film that measures pressures ranging from 2 to 43,200 psi (0.14‑3,000 kg/cm²). When placed between contacting surfaces, it undergoes permanent color change proportional to the applied pressure. Known pressures are used to calibrate absolute pressure magnitudes, which are then applied to analyze scanned pressure maps and generate color‑coded pressure diagrams, as shown in Figure 2b.
|
| piezoresistive sensing |
 |
Direct imprinting can be formed on pressure‑sensitive films of appropriate grade by running the bonding recipe at a pressure setting of 4 bar. Figure 2a shows an image film captured from a 6‑inch diameter bonding tool with poor pressure uniformity. The color map in Figure 2b highlights the annular high‑pressure ring. The line scan in Figure 2c reveals that the outer‑ring pressure exceeds 15 bar while the central pressure is below 3 bar.
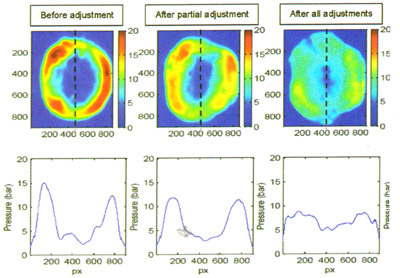
A series of adjustments were then made to the pressure posts of the bonding tool, and pressure uniformity was evaluated by running the identical bonding recipe on pressure‑sensitive films of the same range. The images in Figure 3 illustrate the adjustments that improved pressure uniformity. Note that after adjustment, pressure‑sensitive film analysis showed deviations from the target recipe pressure of 4 bar, which is a by‑product of the instrument’s assumption of a specific wafer area.
Beyond troubleshooting pressure distribution, the same pressure‑sensitive film data can be utilised to monitor and maintain performance in manufacturing practices, such as Six‑Sigma statistical process monitoring.
|
 |
Au/Sn Eutectic Wafer‑to‑Wafer Bonding
Improved uniformity of wafer bonding pressure is applied for applications requiring reliable inter‑wafer electrical connections (approximately 10³‑10⁴ connections per wafer), an inter‑wafer gap of 2‑3 µm, excellent bond‑gap control, high bond strength, and liquid‑tight sealing. Liquid‑tight sealing is required for further processing of the bonded stack via metal deposition, lithography, and etching steps.
Beyond these primary requirements, the bonding process should not introduce significant stress, which would degrade MEMS device performance or cause reliability issues due to stress relaxation over time. Stress sources may stem from the bonding process itself or mismatched coefficients of thermal expansion of the bonding materials. Preferably, a third wafer can be bonded to the stack of the two bonded wafers using the same process.
Upgrades for Au/Sn Eutectic Wafer‑to‑Wafer Bonding
Our experiments employ electroplated Au/Sn solder targeting a composition of 80% Au and 20% Sn with a eutectic temperature of 278°C.² Precise control of solder composition is critical, as minor compositional deviations in either direction can substantially raise the melting temperature.
For instance, a +3% compositional shift results in a melting temperature of 340°C; conversely, a ‑3% shift yields a melting temperature of 333°C. Since the solder thickness is comparable to the seed‑metal thickness, the gold content within the seed metal is also critical.
The top and bottom bonded wafers in this device are: the MEMS wafer containing micromechanical devices with a ring of seed metal surrounding each die; the CAP wafer incorporating corresponding solder rings and underlying seed metal. During bonding, the solder shall wet both wafers to provide mechanical bonding and hermetic sealing.
For preliminary analysis and testing, silicon MEMS wafers were replaced with glass bonding test wafers. The CAP wafer features SiO₂ support structures to provide mechanical stops, so that the final gap between substrates can be well‑defined when the solder is compressed during bonding.
|
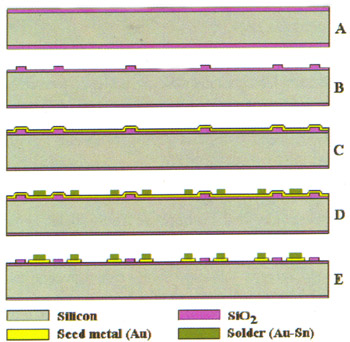
| Figure 4. Fabrication of CAP wafers for bonding testing |
 |
The fabrication of the CAP wafer is illustrated in Figure 4. Standard 6‑inch wafers with a TTV of less than 5 µm are used. After initial oxidation (A), supports are defined via oxide patterning. Cap re‑oxidation (B) is subsequently performed. Typically, the initial oxide thickness is 3.1 µm, and a 1.0‑µm‑thick oxide is grown in the second oxidation step; the final support height is 2.6 µm. Seed metal (4000 Å Au) is deposited on the cap (C), and Au/Sn solder is electroplated using a photoresist mask (D).
Initial electroplating tests were carried out on a research‑and‑development setup, while later work was completed using an industrial‑scale cup‑plating machine. The electroplated solder is typically 65 % Au and 35 % Sn with a thickness of 2.0‑2.5 µm, and exhibits 5‑10 % non‑uniformity across the wafer. Patterning and removal of the seed metal layer from non‑plated areas is the final step of cap pre‑processing (E).
The study also found that the design of the seed‑metal pattern influences bonding results. Patterns with multiple thin solder lines (50‑60 µm wide) provide better sealing than a single wide solder line with an equivalent solder volume. Depending on the design, the entire seed layer (4000 Å) can be consumed during bonding to form the eutectic composition. As the liquid solder is compressed during bonding, additional gold is consumed when the solder floods new regions of the patterned seed layer.
Although Au diffuses rapidly within the solder, the Au concentration at the periphery of the solder lines can be higher than at their centres. This compositional difference makes the solder difficult to compress. It was found that multiple solder lines yield the most consistent results.
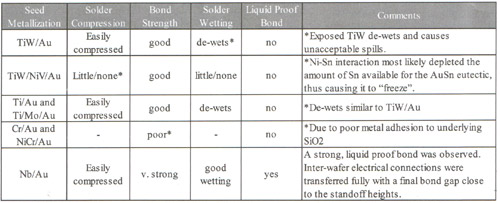
The bonding process is performed in a wafer bonder under vacuum at bonding temperatures ranging from 300 °C to 350 °C. The applied pressure is set to 4 bar, and the aforementioned compensated pressure plate is used in most cases. Several types of seed metals were investigated, and the results are summarised in Table 1. For all tests presented herein, glass bonding test wafers were used instead of silicon MEMS wafers to enable visual evaluation of solder flow.
|
| Table 1. Summary of metal bonding results for several seed crystals |
 |
Seed Metallization Experimental Results
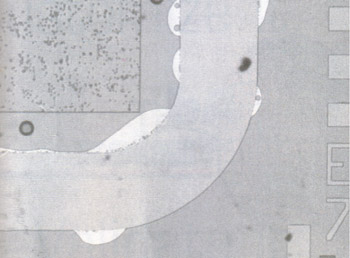
For TiW/Au, Ti/Au and Ti/Mo/Au, a common issue is solder overflow after seed metallization solder dewetting. Figure 5 shows an example of overflow under this condition. Figure 6 presents wafer‑level photographs of overflow when using TiW/Au. For wafers with dewetted solder, the resulting bonds possess considerable mechanical strength (in most cases, strong enough to withstand dicing) yet are not water‑resistant.
|
|
Figure 5. Solder overflowing beyond the seed net area after soldering
|
 |
TiW/NiV/Au seed metallization serves as a good example of several inherent difficulties in thin‑film bonding systems. In this case, the solder does not compress or flow due to the presence of nickel in the seed metallization. EDX analysis of the solder‑seed interface reveals Sn depletion, which is likely caused by Ni/Sn interactions. Owing to insufficient Sn available for Au, the solder composition becomes non‑eutectic and remains frozen up to the maximum temperature of 350°C. Since the solder is not liquefied, solder flow is minimal with little to no compression. Surprisingly, the resulting bond still exhibits good mechanical strength.
Optimal results are achieved using Nb/Au seed metallization³⁻⁴. Here the solder is liquefied, gaps are readily compressed, bond strength is favorable, and a fluid‑tight seal is provided for the chips. The final bond gap between wafers is at the desired stand‑off height.
Figure 6 presents photographs of a half‑wafer bonded with Nb/Au metallization and a half‑wafer bonded with TiW/Au metallization. Both samples were bonded using the same bonding tool and subsequently split into two halves. De‑wetting of the TiW metallization (left side) is clearly visible even to the naked eye.
In Figure 6, the left half‑wafer (TiW/Au seed) shows solder overflow resulting from solder de‑wetting after bonding. Note that pressure non‑uniformity is evident by observing the most severe overflow at the outer ring of the wafer and progressively less overflow toward the center. The right half‑wafer (Nb/Au seed) is well‑bonded with no solder overflow. Pressure non‑uniformity is not apparent on the right side.
|
| Figure 6. Comparison of TiW/Au half‑wafer (left) and Nb/Au half‑wafer (right) |
 |
Au‑Sn Solder Compression and Bonding Pressure
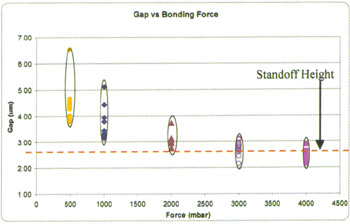
The amount of solder compression during bonding directly affects the gap between the surfaces of bonded substrates. In this part of the study, the applied pressure varied from 500 mbar to 4000 mbar, while other conditions remained unchanged (TiW/Au seed metal was used). The resulting gaps were measured at consistent positions on each wafer using a Zygo profiler and plotted in Figure 7. Each set of colored data points represents multiple measurements from a single wafer.
|
| Figure 7. Measured Gap Between Wafers After Bonding |
Conclusions
Pressure uniformity in wafer bonding tools can be effectively characterized using pressure‑sensitive paper and image‑analysis techniques. The effects of various seed metallization types in Au/Sn eutectic wafer bonding were investigated. For the bonding parameters and metallization ranges studied, Nb/Au yielded the best overall results, featuring good mechanical strength, leak‑tight sealing and no overflow. SiO₂ stand‑offs are an effective approach to produce well‑defined gaps after bonding.
 customer service1